Kategorien
Schlagwörter
1 year of pandemic Bremen Buch Rezension data visualization introduction IUCr justforfun meeting MOOC networks NMR Nobel Prize ontour people prize protein publication Quasi-Periodic Materials refinement Rietveld method SARS-CoV-2 science slam software story symmetry synchrotron teaching topology Young CrystallographersArchive
- Juni 2022
- Mai 2022
- April 2022
- Oktober 2021
- September 2021
- August 2021
- Juni 2021
- Mai 2021
- April 2021
- März 2021
- Dezember 2020
- November 2020
- Oktober 2020
- September 2020
- Juni 2020
- April 2020
- März 2020
- November 2019
- September 2019
- Juli 2019
- März 2019
- Januar 2019
- November 2018
- Oktober 2018
- September 2018
- August 2018
- Juli 2018
- Juni 2018
- Mai 2018
- Januar 2018
- Dezember 2017
- November 2017
- Oktober 2017
- September 2017
- August 2017
- Juli 2017
- Juni 2017
- Mai 2017
- April 2017
- Januar 2017
- Dezember 2016
- November 2016
- Oktober 2016
- September 2016
- Juli 2016
- Mai 2016
- April 2016
- März 2016
- Februar 2016
- Januar 2016
- Dezember 2015
- November 2015
- Oktober 2015
- August 2015
- Oktober 2014
- April 2014
- Februar 2014
- Mai 2013
- März 2013
Schlagwort-Archive: data visualization
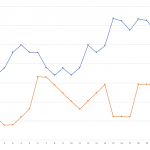
What are you plotting?
Recently, I attended a data visualization workshop where I found out that there are research fields called Scientific Visualization, Information Visualization and Visual Analytics. Their sole purpose is how to (re-)present data. The scientists in these disciplines do not care much … Weiterlesen
Veröffentlicht unter AK-Junge-Kristallographie
Verschlagwortet mit data visualization
Schreib einen Kommentar
Paper writing aids
One of the more crucial skills a young scientist has to learn is writing a good paper. This is a tricky task and requires a precise choice of words as well as a good general understanding of the English language. … Weiterlesen
Veröffentlicht unter AK-Junge-Kristallographie
Verschlagwortet mit data visualization, publication
Schreib einen Kommentar
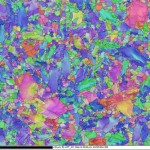
Data Visualization: 50 Shades of Grey
During my research, I frequently have to check reciprocal space reconstructions and take a really close look at the reflections, compare shapes, intensities and amount of diffuse scattering. This is not an easy task to do with grey scale images, as some … Weiterlesen
Veröffentlicht unter AK-Junge-Kristallographie
Verschlagwortet mit data visualization, Young Crystallographers
Schreib einen Kommentar